|
<< Click to Display Table of Contents >> Charts |
  
|
|
<< Click to Display Table of Contents >> Charts |
|
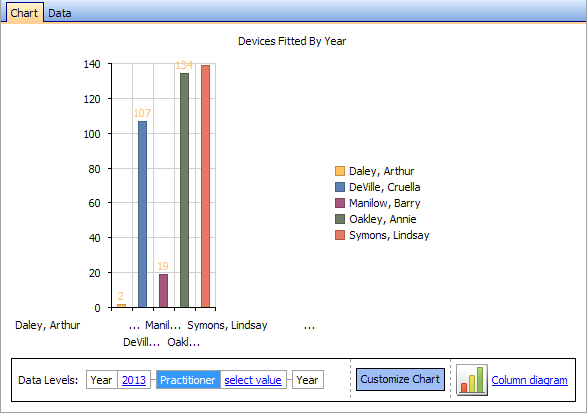
HearAid has built-in charting functions that use Quick Report Templates to generate a data set then display that data as a chart. Creating chart templates is an advanced process and it may be easier to commission HearSoft Pty Ltd to do this for you.
•Select the chart from the Quick Reports|Charts menu
•You will be prompted for any input parameters needed to prepare the chart e.g. a date range


•Once the query has executed and the chart has been displayed the underlying data can be viewed on the Data tab

•The SQL script can be developed and/or modified in Database|Query

•As with Quick Report scripts, Chart scripts contain a section to set up how the chart is to display

•Data can be displayed using different chart styles


•You can drill down into the data by clicking on a bar or data point on the chart, or by clicking one of the options in the Data Level pane
As with any Quick Report, playing around with the query script will not damage your data in any way, but be prepared to be challenged creating your own charts! Many users may find it easier to export the data using the Export Data to export to Excel format and use Excel's charting functions